

Understanding Moving Averages Convergence and Divergence (MACD)
Navigating the world of intraday trading requires a firm grasp of technical analysis. Among the plethora of tools available, the Moving Averages Convergence Divergence MACD stands out as a preferred choice for many traders. The MACD is a trend-following momentum indicator that illustrates the relationship between two moving averages of a security’s price. For intraday traders, it bears particularly high significance due to its ability to signal both the strength and direction of a trend within a short time frame. I use MACD crossovers on 15-minute / 30-minute time frames for my intraday trading decisions which work best and increased my trading accuracy.
What is Moving Averages Convergence and Divergence MACD?
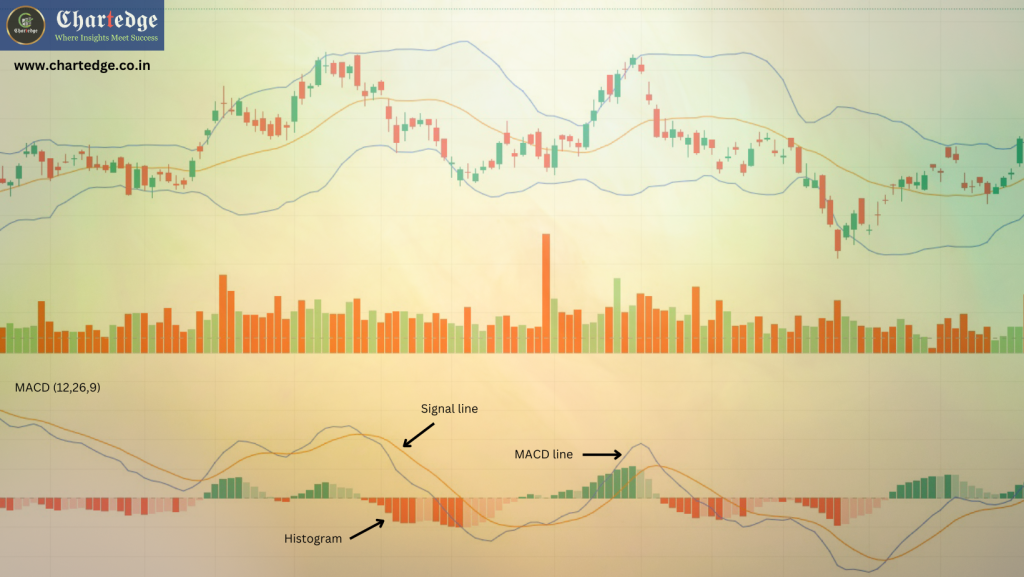
The MACD is calculated by subtracting the 26-period Exponential Moving Average (EMA) from the 12-period EMA. The result of this subtraction is the MACD line. A nine-day EMA of the MACD called the “signal line,” is then plotted on top of the MACD line, which can function as a trigger for buy and sell signals. Traders might also observe the histogram, which represents the distance between the MACD and its signal line; the greater the distance, the more pronounced the trend.
Why Intraday Traders Choose MACD?
Intraday trading, characterized by its quick turnover and need for precise timing, demands tools that can provide real-time information. Moving Averages Convergence and Divergence MACD in identifying trend reversals and momentum makes it an indispensable component of a day trader’s strategy. It helps traders identify potential entry and exit points, ensuring trades are made in line with the current market movement.
How to Interpret Moving Averages Convergence and Divergence MACD?
- Crossovers: When the MACD Line crosses below the signal line, it’s a bearish signal that suggests it might be time to sell. Conversely, when the MACD crosses above the signal line, the market could be turning bullish, and it may be time to buy.
- Divergence: If the MACD Line diverges from the price of the security, it signals a potential end to the current trend. For instance, if a stock’s price creates a new high but the MACD does not, it might indicate a weakening in buy side momentum.
- Dramatic Rise: A sharply rising MACD can indicate that an asset is overbought and may undergo a reversal soon.
- Histogram: Observing the MACD histogram is crucial. If the histogram is rising, it signals that an upward trend is gaining strength; if it’s declining, the downward trend is getting stronger.
Our Share market course teaches traders how to use MACD in Intraday Trading
- Multiple Time Frame Analysis: To refine your trading signals, use MACD in conjunction with other time frames. A signal confirmed on both short and long-term charts can provide a firmer basis for a trade.
- Avoiding False Signals: MACD can produce false signals when the market is volatile. Combine MACD with other indicators, like the Relative Strength Index (RSI), to validate signals.
- Setting the Right Parameters: While the standard MACD parameters (12, 26, and 9) are widely used, intraday traders may adjust these to suit their trading style and the specific asset they are trading.
- Risk Management: Like all technical indicators, the MACD is not infallible. Maintain a robust risk management strategy by setting stop losses and taking profits at predetermined levels.
Integrating MACD into Your Strategy
The Moving Averages Convergence and Divergence MACD is a dynamic tool with various applications. Whether you are using it to gauge the strength of a trend, anticipate reversals, or confirm trade signals, the MACD can be a powerful part of your technical analysis toolkit. However, the key to deploying it effectively relies on understanding its intricacies and integrating it with a comprehensive trading plan.
By using MACD in alignment with an in-depth understanding of the markets, intraday traders can not only enhance their analytical prowess but also increase their potential for profitability in the high-stakes world of day trading.

Conclusion
In conclusion, the Moving Average Convergence Divergence (MACD) is a valuable technical analysis tool that, when used correctly, can provide intraday traders with insights into market momentum and trend direction. It is particularly beneficial due to its ability to generate signals for entry and exit points, helping traders to capitalize on short-term price movements. However, it’s crucial to remember that no indicator should be used in isolation. Successful intraday traders will often combine MACD with other indicators and methods to confirm signals and manage the risks associated with the fast-paced nature of day trading.
The must know websites for Indian stock market www.nseindia.com and www.bseindia.com. Join our share market course and become a expert trader.